Molecular Regulation of Actin Dynamics in Breast Cancer – Essay Example
Molecular Regulation of Actin Dynamics in Breast Cancer – Essay Example
Actin, a prominent protein in the cytoskeleton is highly expressed in the nucleus of normal and cancerous cells and its regulation is an important molecular event in the progression of cancer where it plays crucial roles in the cell motility and migration. It is associated in protein-protein interaction. Actin-binding proteins (ABP) are involved in the molecular regulation of actin structure and dynamics where they modulate the nucleation of new actin filament. Consequently, the activities of ABP are regulated by various signaling pathways so that there is an appropriate spatial and temporal regulation of actin dynamics in cells. The Rho-family GTPases are the most explored actin binding protein and they include RhoA which modulates the formation of contractile stress fibers. The Rac1 activates the formation of lamellipodial actin filament network at the leading edge in motile cells. Membrane phophoinositides are also involved in the regulation of actin dynamics.Molecular Regulation of Actin Dynamics in Breast Cancer – Essay Example. These molecules associate with actin binding protein ultimately regulating the activity of actin. Metastasis plays a prominent role in the pathogenesis of cancer and identification of the mechanism influencing this metastasis is essential in the development of appropriate breast cancer treatment procedures. Metastasis is a complex process encompassing different steps such as neurovascularization, stromal invasion and infiltration of cancer cells into vascular and lymphatic spaces. Introduction Breast cancer is diagnosed in women all over the world and breast cancer metastasis is a leading cause of breast-related mortality in over 90% of cancer patients’ population (Ferlay et al., 2007). Motility of cancer cells is essential in the initial stage of breast cancer metastasis. Identifying the factors facilitating this motility is essential in establishing the contributing factors towards cancer invasion and metastasis. The eukaryotic cell is made of a filamentous network of microfilaments, intermediate filaments and microtubules. This structure is collectively referred to as the cytoskeleton. The cytoplasmic network has long been associated with cell motility and proliferation but studies have shown that actin, a prominent protein in the cytoskeleton is also highly expressed in the nucleus of normal and cancerous cells (Jockusch et al., 2006). Actin cytoskeleton regulation is an important molecular event in the progression of cancer and it plays crucial roles in the cell motility and migration. Among the abundant proteins in eukaryotic cell, actin is the most abundant (Dominguez and Holmes, 2011). This protein is involved in maintaining the complex internal infrastructure of eukaryotic cells. The internal infrastructure of the cell comprises the maintenance of shape and integrity which is associated with cellular functioning. This protein forms a tangle of cross-linked filaments referred to as actin cytoskeleton that provides the organizational scaffold of animal, plant and fungal cells. In a typical cell organization, actin filaments are involved in the complex strenuous, structural tasks for instance, in the movement of myosin in muscle cells. The actin protein stricture encompasses a combination of strength and sensitivity. The actin structure can be termed as “dynamic” in virtue of their formation and roles. The dynamic model of actin is powered by a molecule of ATP which is bound to each actin monomer.Molecular Regulation of Actin Dynamics in Breast Cancer – Essay Example. Free actin bound to an ATP molecule, binds firmly to a
ORDER A PLAGIARISM-FREE PAPER NOW
Estrogen promotes growth of estrogen receptor-positive (ER+) breast tumors. However, epidemiological studies examining the prognostic characteristics of breast cancer in postmenopausal women receiving hormone replacement therapy reveal a significant decrease in tumor dissemination, suggesting that estrogen has potential protective effects against cancer cell invasion. Here, we show that estrogen suppresses invasion of ER+ breast cancer cells by increasing transcription of the Ena/VASP protein, EVL, which promotes the generation of suppressive cortical actin bundles that inhibit motility dynamics, and is crucial for the ER-mediated suppression of invasion in vitro and in vivo. Interestingly, despite its benefits in suppressing tumor growth, anti-estrogenic endocrine therapy decreases EVL expression and increases local invasion in patients. Our results highlight the dichotomous effects of estrogen on tumor progression and suggest that, in contrast to its established role in promoting growth of ER+ tumors, estrogen has a significant role in suppressing invasion through actin cytoskeletal remodeling.
Introduction
Estrogen receptor-positive (ER+) breast cancers are the most commonly diagnosed subgroup of breast tumors, and most breast cancer deaths are caused by metastatic ER+ tumors1,2. Several lines of evidence suggest that the risk of ER+ breast cancer increases with estrogen exposure during a women’s lifetime, for example, due to earlier menarche or late menopause (i.e., longer exposure to reproductive hormones due to longer ovarian activity)3. Moreover, large-scale clinical trials designed to look at the effects of hormone replacement therapy (HRT) on breast cancer incidence in postmenopausal women revealed that HRT increased the risk of breast cancer4,5. However, extended exposure to estrogen during HRT was associated with less dissemination and better outcome5. Interestingly, HRT did not reduce the locoregional recurrence rate6, suggesting that under HRT, recurrent tumors are able to develop and grow locally at the initial tumor site but are less prone to disseminate and metastasize to distant sites. Molecular Regulation of Actin Dynamics in Breast Cancer – Essay Example.
In this study, we investigated this potential protective role of estrogen against cancer dissemination and metastasis. In a meta-analysis, including 17,497 patients from 10 clinical cross-sectional studies, we found that the metastatic burden in patients who developed breast cancer while on estrogen treatment was reduced. In addition, we found that ER is associated with lower invasive capacity. Despite the significant role of actin remodeling in cell invasion, the hormonal regulation of the actin cytoskeletal architecture in ER+ breast cancer cells, is not known. We found that ER promotes the formation of distinct actin structures with protective properties against invasion. We used a multimodal targeted discovery approach to examine the transcriptional regulation of actin cytoskeletal regulators by ER. Among a comprehensive list of known actin regulators, we identified a member of the Ena/VASP family of proteins, EVL, as the most significant transcriptional target of ER. We found that EVL is up-regulated in ER+ tumors and suppresses invasion, and that EVL levels are reduced in tumors after anti-estrogenic hormone therapy, which was associated with increased invasion.
Results
ER is associated with low breast cancer dissemination
In a meta-analysis of ten epidemiological studies6,7,8,9,10,11,12,13,14,15, we investigated lymph node (LN) positivity in postmenopausal women diagnosed with breast cancer while on HRT (current-users), compared to women who never used HRT (never-users). We used LN status as a metric of tumor cell dissemination and the commonly used cutoff of >3 (LN >3) as a marker of distant metastasis beyond the regional axillary LNs. HRT was associated with lower odds ratio (OR) of having LN >3, suggesting less distant dissemination (Fig. 1a, b). Moreover, to examine both regional and distant dissemination, we performed a binary assessment of LN status (LN+ or LN−). Molecular Regulation of Actin Dynamics in Breast Cancer – Essay Example. This analysis showed that OR of having LN+ was lower in HRT current-users, indicating less regional and distant dissemination (Supplementary Fig. 1a, b). In addition, in ER+ breast cancer, tumors with low LN dissemination had higher ER levels, as compared to tumors with high LN dissemination (1.8-fold in LN ≤3 and 1.5-fold in LN−, compared to LN >3 and LN+, respectively); not surprisingly, patients with less LN-disseminated tumors have higher survival rate (Supplementary Fig. 1c, d).
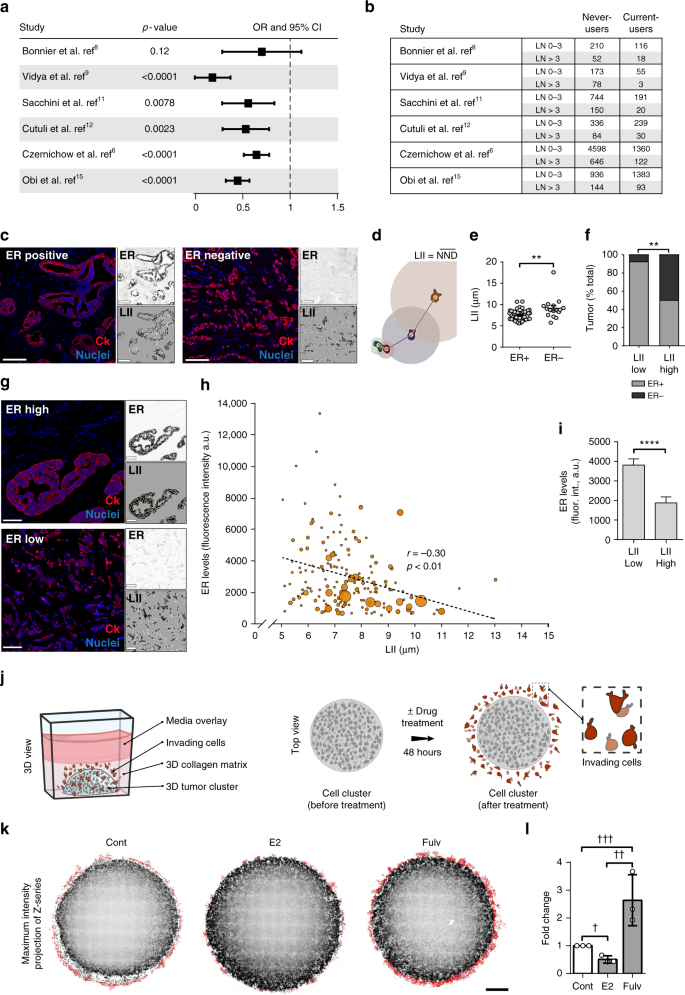
ER expression is associated with low dissemination of breast cancer cells. aMeta-analysis of LN dissemination. Forest plot showing odds ratio, with 95% confidence interval (OR, 95% CI) of LN >3 in current-users compared with never-users of HRT. b Number of never-users and current-users with either LN ≤3 or LN >3 in the studies analyzed in a. c Representative images of ER+ (left panel) and ER− (right panel) tumors from TMA#1 (CDP-BCP-TMA), labeled for cytokeratin (red) and nuclei (blue). Scale bar is 100 µm. Top-right inset shows ER labeling and bottom-right inset shows binary masks of cytokeratin stain (black) and nuclei (orange). d Illustration of local invasion index (LII) measurement. Connecting lines represent the nearest neighbor distance (NND) of illustrated cells (color of each line matches color of corresponding cell). LII is calculated as mean NND. e Quantification of LII in TMA#1 (mean ± s.e.m); **p = 0.001 .Molecular Regulation of Actin Dynamics in Breast Cancer – Essay Example/ (unpaired t test). f Percentage of ER+ (gray) and ER− (black) tumors in low (≤7 µm) and high (≥9 µm) LII bins in TMA#1; **p = 0.002 (unpaired t test). g Representative images of luminal B breast tumors from TMA#2 (Cedars-Sinai LumB TMA) with high (top panel) or low (bottom panel) ER expression. Top-right inset shows ER labeling and bottom-right inset shows binary masks of cytokeratin stain (black) and nuclei (orange). Scale bar is 100 µm. h Scatter plot of LII and ER levels in TMA#2. For each data point, bubble area is proportional to the number of positive lymph nodes in the corresponding patient; r is Pearson’s correlation coefficient; correlation is significant at p < 0.01. a.u. = aribitrary units. i ER levels in tumors with low (≤7 µm) and high (≥9 µm) LII in TMA#2; mean ± s.e.m. ****p < 0.0001 (Welch’s t test). j Illustration of 3D culture system for quantification of invasion in vitro. Cells embedded in central area invade into surrounding collagen matrix. Zoomed-in illustration of the boxed area shows invading cells in red. k Maximum intensity projections of confocal z-series of ER+ breast cancer MCF7 cells treated with drug vehicle, estradiol (E2), or fulvestrant (fulv). Binary mask (red) highlights invaded cells. Scale bar is 500 µm. l Quantification of invasion. Data are from three independent experiments; mean ± s.d. †p = 0.003, ††p = 0.01, †††p = 0.03 (unpaired t test)
We investigated the effect of ER on cancer cell invasion, the initial step in metastatic dissemination, in breast cancer patient samples from two tissue microarrays (TMA#1 and TMA#2; see Methods). We determined the local invasion index (LII) for each tumor sample by employing the nearest neighbor distance (NND) approach, typically used in spatial analysis to study the second-order effect or local variation of point patterns16. Treating cancer cells (identified by cytokeratin positivity) as stochastic events in a point pattern analysis, we measured the distance between the nucleus of each cell and the nucleus of its most proximal neighboring cell (NND) and calculated LII as the average NND within each tumor sample (Fig. 1c, d). Molecular Regulation of Actin Dynamics in Breast Cancer – Essay Example.
In TMA#1, we analyzed 64 samples from ER+ and ER− tumors, exhibiting a wide range of LN dissemination. Not surprisingly, compared to the more aggressive ER− tumors, ER+ tumors exhibited significantly lower LII (Fig. 1e, f), suggesting that ER positivity is associated with lower invasion rate. Moreover, tumors with LII ≤7 µm (denoted as LII low) were associated with foldfold less LN dissemination than tumors with LII ≥9 µm (denoted as LII high) (Supplementary Fig. 1e), suggesting that, in addition to ER positivity, low local invasion corresponds, as expected, to low distant LN dissemination. These data suggest that local invasion is a valid parameter to assess dissemination.
Furthermore, we investigated the association between ER expression and invasion in TMA#2, which comprised samples from ER+ luminal B tumors. Among ER+ tumors, luminal B tumors disseminate more extensively and exhibit a wide range of ER expression levels17. Quantitative analysis of ER levels (average intensity of ER immunofluorescence in each tumor sample) and LII in 180 samples from TMA#2 revealed a significant negative linear correlation between ER expression and invasion (Fig. 1g–i). In addition to expressing higher ER, low LII tumors are associated with less LN dissemination as compared to high LII tumors (Supplementary Fig. 1f). Moreover, analysis of survival rates in a cohort of patients with luminal B tumors18 shows that high ER is associated with better outcome (Supplementary Fig. 1g). Together, these data demonstrate that in luminal B breast cancer, tumors with high ER expression exhibit low dissemination and are less invasive.
To investigate the direct effect of altering ER activity on invasion, we developed an in vitro culture system that allowed us to quantify the level of invasion of ER+ MCF7 breast cancer cells into 3D matrix under estradiol (E2) or ER inhibitor treatment (Fig. 1j). We found that ER inhibition enhanced invasion of MCF7 cells, whereas E2 suppressed it (Fig. 1k, l). These results are consistent with previous reports of ER-suppressing invasiveness of breast cancer cells19,20. Conversely, as expected, ER inhibition suppressed proliferation of the cells, whereas E2 promoted proliferation (Supplementary Fig. 1h).Molecular Regulation of Actin Dynamics in Breast Cancer – Essay Example. Together, these results suggest that the observed changes in invasion upon altering ER activity are not the result of changes in the proliferation rate, but are rather induced by enhanced cell motility.
ER promotes suppressive cortical actin bundles
Using kymography analysis, we quantified the motility dynamics of membrane protrusion, which is crucial for cancer cell invasion21. This analysis showed a marked decrease in the number and speed of membrane ruffles in E2-treated MCF7 cells, as compared to control (Fig. 2a–c and Supplementary Movie 1). Conversely, protrusive activity was significantly enhanced at the leading edge of MCF7 cells treated with ER inhibitors (Fig. 2a–c). We validated these data in ER+ breast cancer T47D cells (Fig. 2d–f and Supplementary Movie 2). Mechanistically, enhanced motility dynamics are well-established characteristics of an aggressive invasive behavior22; therefore, the suppression of protrusive activity by ER is in line with the low dissemination of tumor cells with high ER expression.
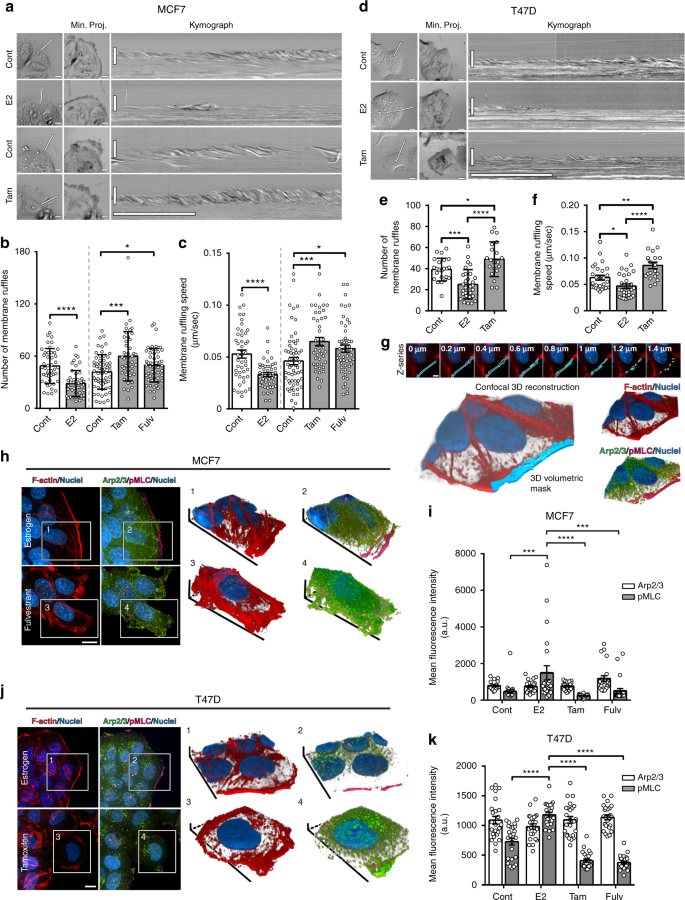
ER-mediated actin cytoskeletal remodeling induces suppressive cortical actin bundles (SCABs). a Leading edge kymography in representative time-lapse movies (Supplementary Movie 1) of control and E2-treated MCF7 cells (cultured under hormone starvation conditions), and control and ER-inhibited cells (cultured in regular media). Molecular Regulation of Actin Dynamics in Breast Cancer – Essay Example. Left panels indicate position at which kymographs were registered (line), and middle panels show minimum intensity projections from entire time series (Min. Proj.); scale bar is 10 µm. Right panels show corresponding kymographs; vertical scale bar is 10 µm; horizontal scale bar is 5 min. b Membrane ruffle quantification; mean ± s.d; *p = 0.03, ***p = 0.0005, ****p < 0.0001 (Welch’s t test). c Ruffling speed quantification; mean ± s.e.m; *p = 0.01, ***p = 0.0007, ****p < 0.0001 (Welch’s t test). Data from three independent experiments (n ≥ 45 cells per group). d Leading edge kymography in representative time-lapse movies (Supplementary Movie 2) of T47D cells. e Membrane ruffle quantification; mean ± s.d; *p = 0.03, ***p = 0.0002, ****p < 0.0001 (Welch’s t test). f Ruffling speed quantification; mean ± s.e.m; *p = 0.01, **p = 0.004, ****p < 0.0001 (Welch’s t test). Data from two independent experiments (n ≥ 30 cells per group). g Volumetric analysis of leading edge actin. Illustrative confocal z-series and corresponding 3D binary mask, demarcated as the area within 3 µm of cell edge and used to quantify leading edge fluorescence intensity. h Maximum intensity projections of z-series of E2-treated or fulv-treated MCF7 cells (Supplementary Movie 4), and 3D reconstructions of boxed areas; F-actin (red), Arp2/3 (green), and pMLC (magenta). Scale bar is 10 µm. i Quantification of leading edge Arp2/3 and pMLC in MCF7 cells. Data from three independent experiments (n = 21 cells per group; mean ± s.e.m). By two-way ANOVA, interaction analysis shows significant differences at p < 0.0001 (df = 3); pMLC values are significantly different in E2-treated group compared to other groups (p < 0.001). Arp2/3 values are not significantly different between groups. j Maximum intensity projections of z-series of E2-treated or tam-treated T47D cells and 3D reconstructions of boxed areas. F-actin is red, Arp2/3 in green, and pMLC in magenta. Scale bar is 10 µm. k Quantification of leading edge Arp2/3 and pMLC in T47D cells. Data from three independent experiments (n = 21 cells per group; mean ± s.e.m). By two-way ANOVA, interaction analysis shows significant differences at p < 0.0001 (df = 3); pMLC values are significantly different in E2-treated group compared to other groups (p < 0.001). Arp2/3 values are not significantly different between groups. Molecular Regulation of Actin Dynamics in Breast Cancer – Essay Example.
Motility dynamics of membrane protrusions are regulated by the architecture of the actin cytoskeleton22. Examining actin cytoskeletal remodeling by ER, we found that E2-treated MCF7 cells exhibited prominent cortical actin bundles, which were concurrent with the absence of protrusions. Conversely, ER inhibition diminished these bundles and enhanced cell scattering and dissemination (Supplementary Fig. 2a, b and Supplementary Movie 3). Similar actin bundles have been previously observed in normal cells, where they constitute a contractile cortical barrier that suppresses Arp2/3-mediated protrusions23,24. We quantitated the levels of phosphorylated myosin light chain (pMLC), as a contractility marker25, and of Arp2/3 at the leading edge after altering ER activity in ER+ breast cancer cells. Considering the 3D morphometric properties of cortical bundles and protrusive ruffles, we used volumetric analysis of fluorescence intensity in confocal z-series (Fig. 2g). E2 treatment significantly increased pMLC at cortical bundles, demonstrating elevated contractility, which was suppressed by ER inhibition (Fig. 2h, i and Supplementary Movie 4). The decrease in cortical contractility coincided with Arp2/3-positive leading edge ruffles; however, no significant changes in Arp2/3 levels at the leading edge were detected, suggesting that other actin regulators could be driving protrusion under ER inhibition (Fig. 2i). We confirmed these data in T47D cells (Fig. 2j, k). These results indicate that the suppressive effects of ER are mediated through remodeling of the actin cytoskeleton to generate suppressive cortical actin bunds (SCABs). Molecular Regulation of Actin Dynamics in Breast Cancer – Essay Example.
SCABs suppress leading edge motility
We further examined the relationship between cortical contractility and membrane motility dynamics. Using live-cell TIRFM, we imaged SCABs at the leading edge of MCF7 and T47D cells, before and after inhibiting contractility using the Rho-associated protein kinase (ROCK) inhibitor, Y-27632; the actin cytoskeleton was labeled with iRFP-Lifeact, and SCABs with MLC-mRuby2 (Supplementary Movie 5). Inhibiting contractility resulted in the loss of MLC at the leading edge and the dissolution of SCABs, and led to a rapid increase in protrusive activity, revealing a direct relationship between SCABs and the suppression of membrane motility dynamics (Fig. 3a, b). In addition, we validated the existence of SCABs, their contractile nature, and their suppressive effects in two types of epithelial cells: Madin-Darby canine kidney (MDCK) epithelial cells and Caco-2 human intestinal epithelial cells (Fig. 3c, d). Immunolabeling of pMLC in these cells revealed the contractile nature of these cortical structures, which corresponded with the absence of membrane protrusions (Fig. 3b). Importantly, the dissolution of SCABs dramatically increased the motility dynamics of the leading edge in both epithelial cell types (Fig. 3c). These data suggest that SCABs—and the attenuation of protrusive activity by SCABs—are present not only in ER+ breast cancer cells, but are common features of epithelial cells. ER is potentially enriching for SCABs by inducing the expression of actin regulators that promote SCAB formation.
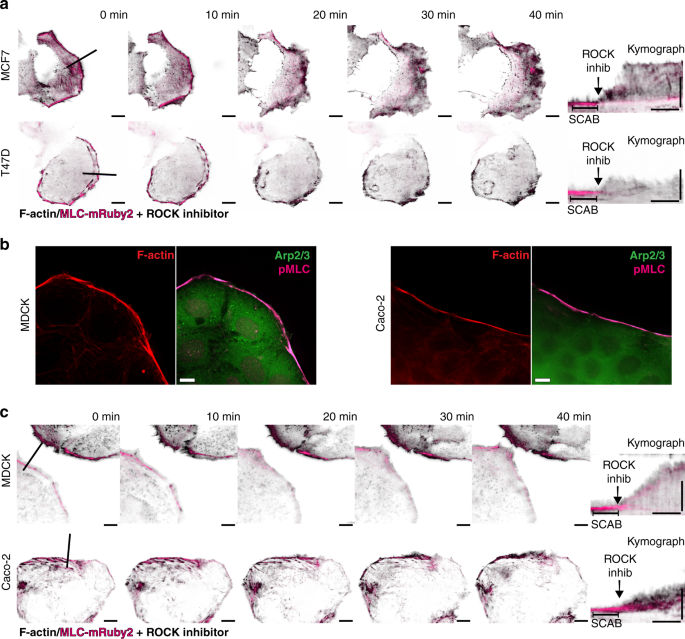
SCABs suppress leading edge motility in a myosin contractility-dependent manner. a Leading edge kymography in MCF7 cells (top row) and T47D cells (bottom row) expressing iRFP-Lifeact (black) and MLC-mRuby2 (magenta) before and after dissolving SCABs using 25 µM ROCK inhibitor. Left panels are images from TIRF microscopy time-lapse series before and after the addition of ROCK inhibitor (Supplementary Movie 5). Molecular Regulation of Actin Dynamics in Breast Cancer – Essay Example. Scale bar is 10 µm. Line shows the leading edge position at which kymographs were registered. Right panel shows MLC kymograph (denoting SCABs) superimposed over Lifeact kymograph (demarcating the leading edge). Vertical scale bar is 10 µm and horizontal scale bar is 10 min. b Immunofluorescence of SCAB in MDCK epithelial cells and Caco-2 human intestinal epithelial cells. Representative images for F-actin, pMLC, and Arp2/3. Scale bar is 10 µm. c Leading edge kymography in MDCK cells (top row) and Caco-2 (bottom row) cells expressing iRFP-Lifeact (black) and MLC-mRuby2 (magenta) before and after dissolving SCABs using 25 µM ROCK inhibitor. Scale bar is 10 µm. Line shows the leading edge location at which the kymograph was registered. Right panel shows MLC kymograph (denoting SCABs) superimposed over Lifeact kymograph (demarcating the leading edge). Vertical scale bar is 10 µm and horizontal scale bar is 10 min
EVL is a transcriptional target of ER
Remodeling of the actin cytoskeleton is controlled by a multitude of actin regulators whose differential expression in cancer leads to distinct architectures that impact invasion26. To identify actin-binding proteins that are transcriptionally regulated by ER, we took a targeted discovery approach by examining the differential expression of a curated list of 285 actin regulators in ER+ vs. ER− tumors using 12 datasets18,27,28,29,30,31,32,33,34,35,36,37 (Supplementary Data 1, 2). The list of actin regulators was curated by first generating an extended list from the Gene Ontology (GO) Consortium using the broad search term “actin cytoskeleton,” and then refining it by limiting the selection to genes that specifically express actin-binding proteins. In examining 12 independent microarray datasets, the Ena/VASP family member, EVL, was most differentially expressed in ER+ tumors, compared to ER− tumors (Fig. 4a, Supplementary Fig. 3a, and Supplementary Data 2, 3). Molecular Regulation of Actin Dynamics in Breast Cancer – Essay Example/ This result was validated using the breast cancer The Cancer Genome Atlas (TCGA) RNA-sequencing (RNA-seq) dataset (Supplementary Fig. 3b and Supplementary Data 4, 5). Moreover, unsupervised clustering analysis of the RNA-seq data showed that EVL closely clustered with ESR1, the gene encoding ERα (Fig. 4b), and their expression exhibited the highest correlation index (Supplementary Data 6).
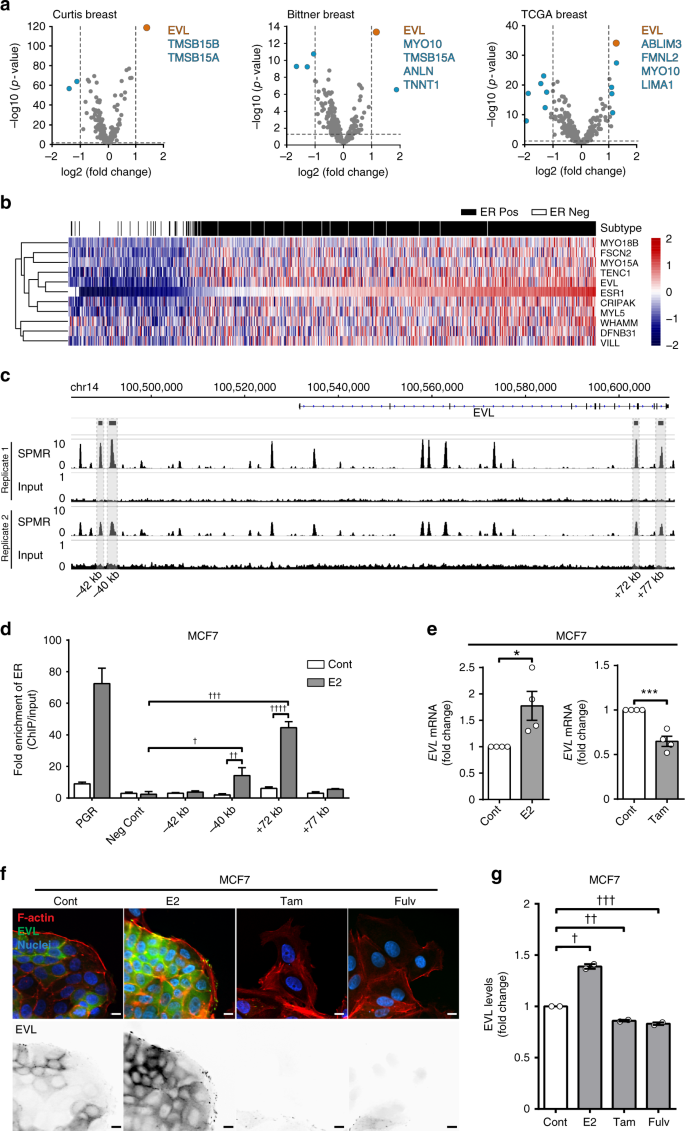
EVL is a transcriptional target of ER. a Differential gene expression analysis of actin cytoskeletal regulators in ER+ vs. ER− breast tumors. Volcano plot of significance (−log10 of p value) vs. log2 fold change. Horizontal dashed line represents threshold for significance at p < 0.05. Vertical dashed lines represent threshold for positive or negative twofold change in gene expression. Insets are lists of genes that passed both thresholds in descending order of significance (lists were limited to five genes; full data analyses are presented in Supplementary Data 3). b Unsupervised clustering analysis of TCGA RNA-seq dataset. Heatmap, generated by row scaling, showing expression of genes in the ESR1 cluster. Tumor samples were classified into ER+ (black) and ER− (white) based on ER status (paired t test used to determine significance). c Analysis of ER binding by chromatin immunoprecipitation (ChIP). Molecular Regulation of Actin Dynamics in Breast Cancer – Essay Example. Genomic region surrounding EVLshowing ER-ChIP sequencing profile as SPMR (signal per million reads) trace of two independent ER-ChIP sequencing samples, generated by MACS2.0 and visualized by IGV (Integrative Genomics Viewer). Corresponding input profiles are shown at ×10 scale to clearly show the input DNA openness bias. d Fold enrichment of ER binding at four peaks found by ChIP-seq, in addition to positive (PGR) and negative controls. Fold enrichment is calculated as [DNA]-normalized ChIP/Input of 2ΔΔCt. Values are means of data from four replicates; mean ± s.e.m.; p values were generated by paired t test comparing E2 treated to vehicle treated and E2 treated to negative control; †p = 0.009, ††p = 0.007, †††p = 0.001, ††††p = 0.001. e Analysis of the Regulation of EVL expression by ER. qPCR of EVL mRNA in MCF7 cells treated with corresponding drugs for 24 h, normalized to GAPDH. Fold change shown between treatment groups. Values are means of data from four independent experiments; mean ± s.e.m.; *p = 0.03, ***p = 0.0008 (unpaired t test). f Immunolabeling of MCF7 cells after corresponding drug treatment for 72 h. Bottom row shows EVL labeling. Scale bar is 10 µm. g Quantification of EVL levels in MCF7 cells after treatment with corresponding drugs for 72 h. Values are means of data pooled from two independent experiments; mean ± s.e.m. †p = 0.03, ††p = 0.03, †††p = 0.04 (Welch’s t test)
Strikingly, using ER chromatin immunoprecipitation-sequencing (ChIP-seq) analysis, we found 12 high confidence ER peaks (defined in Methods) within the EVL gene and within 60 kb upstream of the transcription start site, suggesting a direct regulation of EVL by E2-stimulated ER (Fig. 4c). We further investigated four of the high confidence peaks by ChIP-quantitative real-time PCR (qPCR) and two peaks showed significant enrichment in ER binding after E2 stimulation as compared to negative control targets (Fig. 4d and Supplementary Data 7). Molecular Regulation of Actin Dynamics in Breast Cancer – Essay Example.